This module provides both a macro and micro view of the sales pipeline, focusing on financial values, team performance, and reasons for lost deals. It's essential for sales managers and directors who need to understand where the money is stuck and how to optimize conversion.
Time Filter: Lets you pick the analysis period (e.g.: last 7 days, 15 days, 3 months).
View Filter: Quickly switch between Deals (Funnel) view, Multi-service, and other modules.
Interactivity (Power BI): When you click any chart (e.g.: "Won Deals"), all other tables and metrics on the dashboard auto-filter to show only that context.
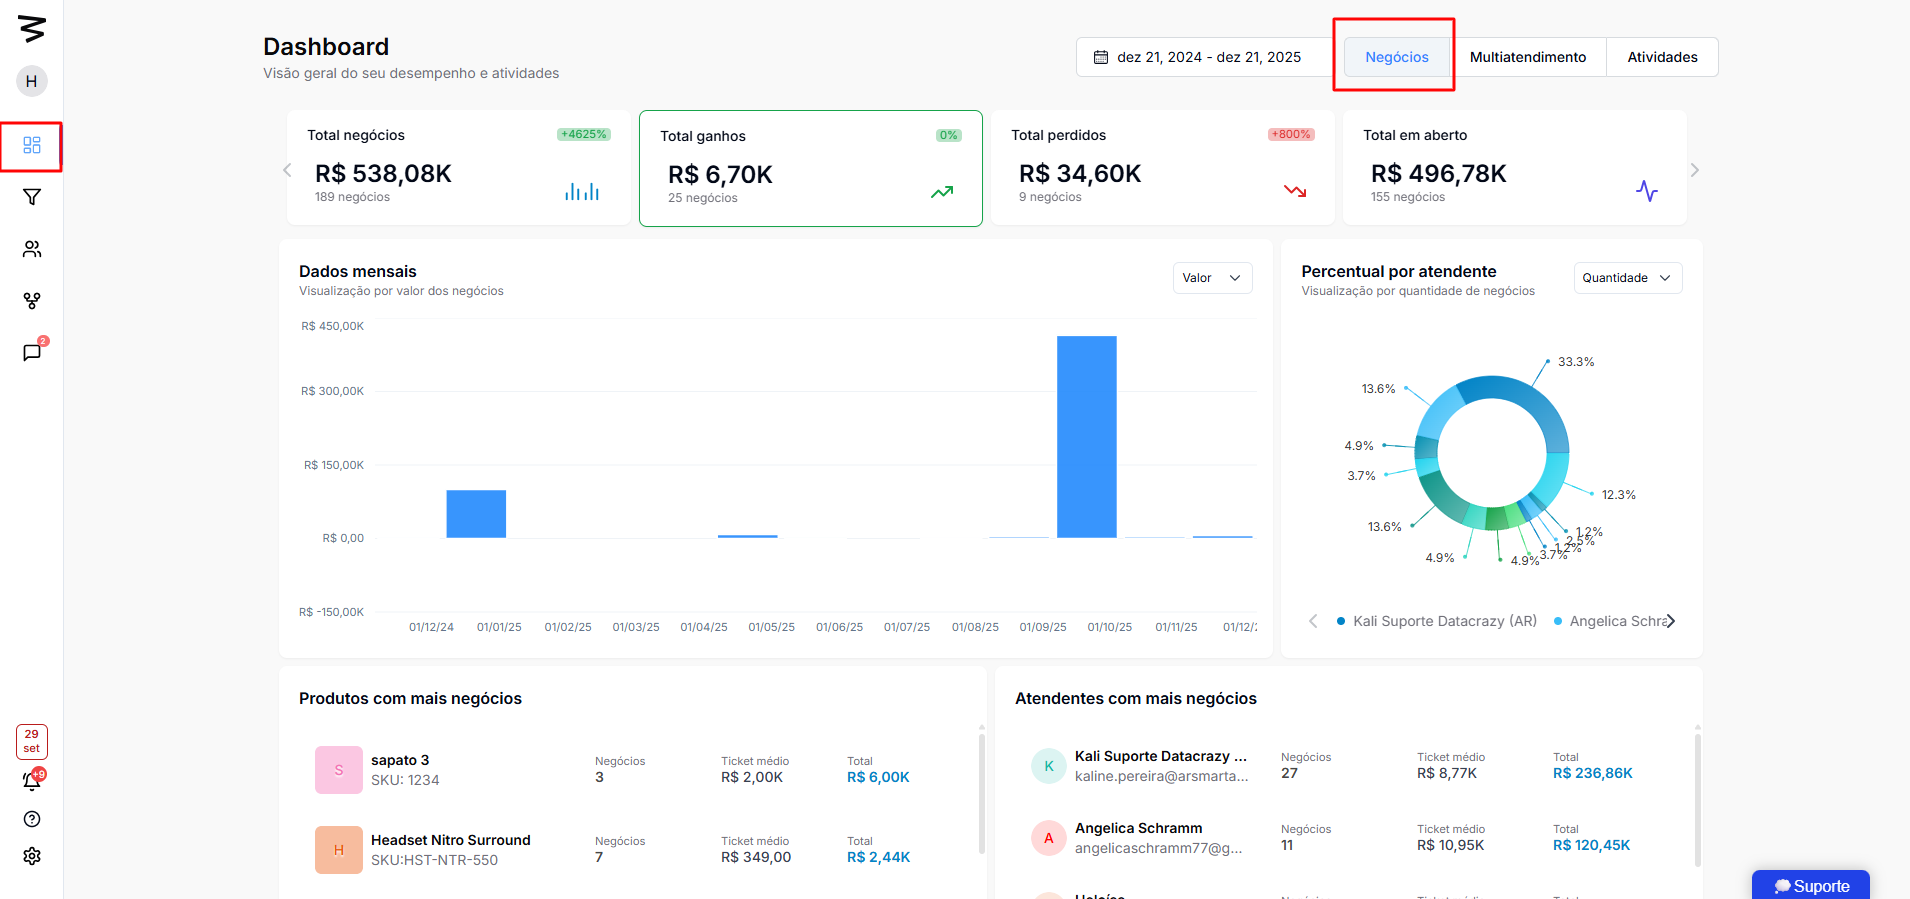
The top panel sums up the financial health of the funnel:
Total Deals: Total volume and accumulated value in CRM (ex: 516 deals, R$ 1.9M).
Won Deals: Completed sales (value and amount). Includes percentage comparison with the previous period.
Lost Deals: Opportunities that didn't convert. Shows the financial value left on the table.
Open Deals: Active opportunities still in negotiation (not won or lost).
When filtering by "Won", the dashboard reveals:
Ranking by Sales Rep: Who sold the most (amount and value) and each rep's average ticket.
Ranking by Product: Which "flagship" product brought in most revenue.
Sale Details: Endless list of won customers, showing tags, product, pipeline, and how long it took to close the deal (sales cycle).
By filtering by "Lost", you can diagnose problems:
Reason for Loss: Pie chart showing the reasons (e.g.: "72% stopped responding").
Who loses most: Identifies salespeople with high loss rates and the financial value involved.
Loss Cycle: Identifies if the lead was lost on the same day or after many days of negotiation.
Justifications: Access to notes left by the salesperson explaining why the deal was lost (e.g.: "High price", "No stock").
Shows future potential:
Stagnation: Finds out how many days a deal has been stuck in the same stage of the pipeline (e.g.: "6 days without movement").
Volume by Stage: How many deals are in "Prospecting", "Negotiation" or "Closing".
By clicking on a specific seller's name, the individual performance profile ("Employee Journey") opens:
Financial Summary: Total won vs. lost by the person.
Productivity: Scheduled activities (calls, meetings) vs. overdue activities.
Complete History: Timeline of all actions taken by the seller in the CRM.
Data Entry: The dashboard depends on correct manual input. If a seller doesn't update the status to "Won" or "Lost", the financial data will be wrong.
Recovery Action (Follow-up): If the main lost reason is "Stopped responding", the team should create reactivation campaigns with discounts or objection handling.
Stagnation Management: Keep an eye on "Open Deals" that have been stuck in the same stage for too long to encourage team proactivity.
Video Source:
